Read next
Power Electronics and Power Management
Power electronics emerged in the 1970s; prior to that, it was known as converter technology or power conversion technolo...
Articles
2026-02-22

CATDOLL CATDOLL 115CM Cici Silicone Doll
Articles
2026-02-22
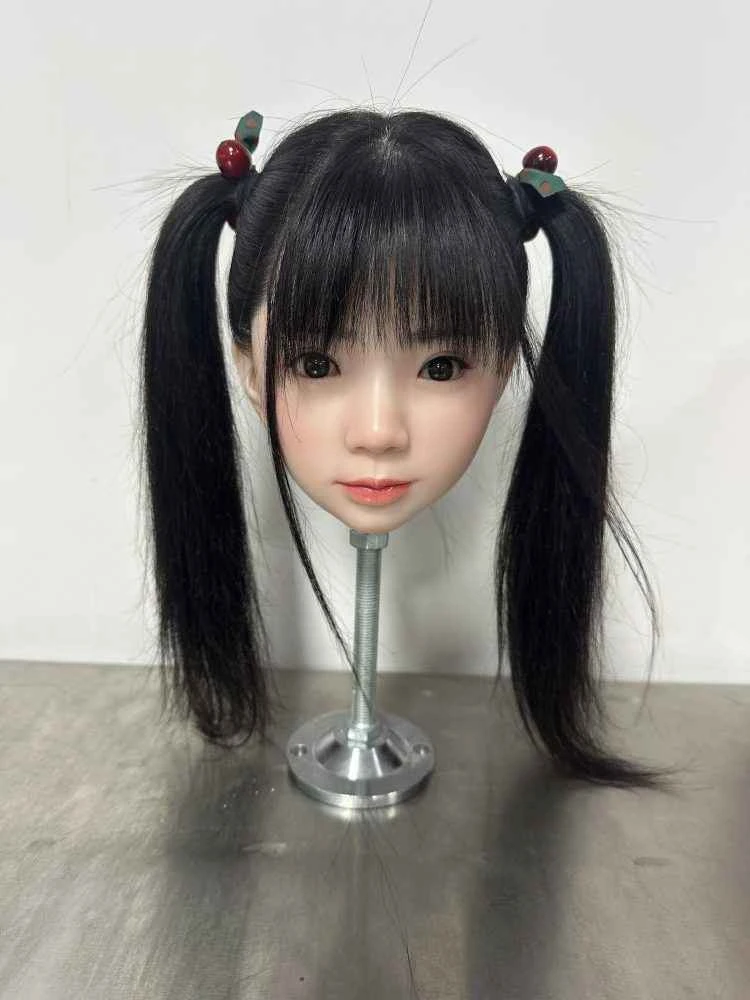
CATDOLL Himari Hard Silicone Head
Articles
2026-02-22

CATDOLL Q 108cm Asian tone – Petite TPE Body with Realistic Features
Articles
2026-02-22