Read next
Analysis, Design and Implementation of Control System for Warehouse-type Intelligent Robotic Parking Equipment
Abstract : This paper mainly introduces the main mechanical structure of the warehouse-type robot parking equipment and ...
Articles
2026-02-22
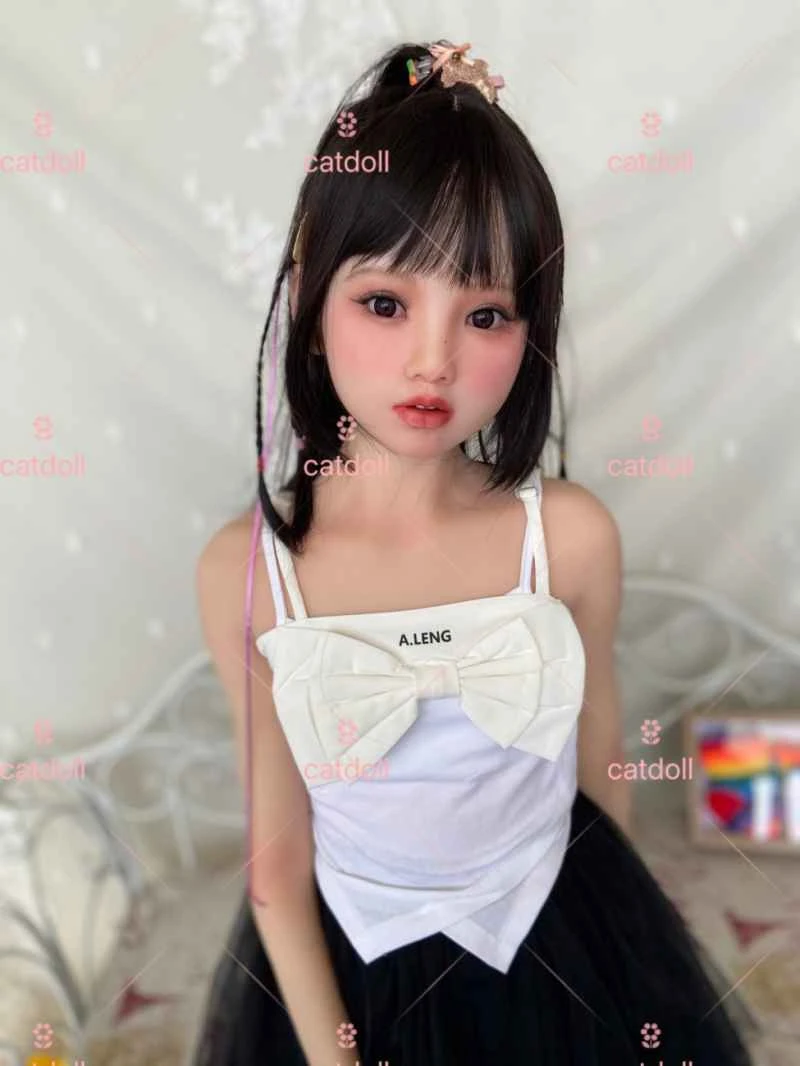
CATDOLL 139CM Yuan (TPE Body with Soft Silicone Head)
Articles
2026-02-22
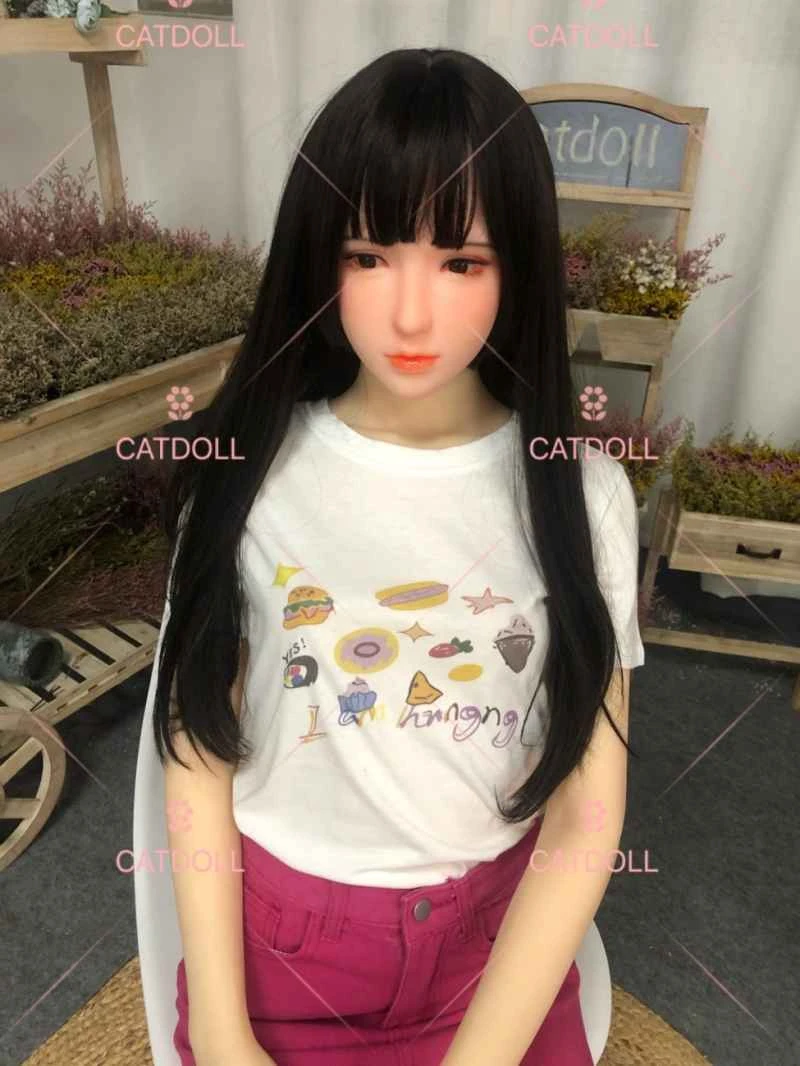
CATDOLL 166CM An TPE
Articles
2026-02-22

CATDOLL 115CM Hedi TPE
Articles
2026-02-22