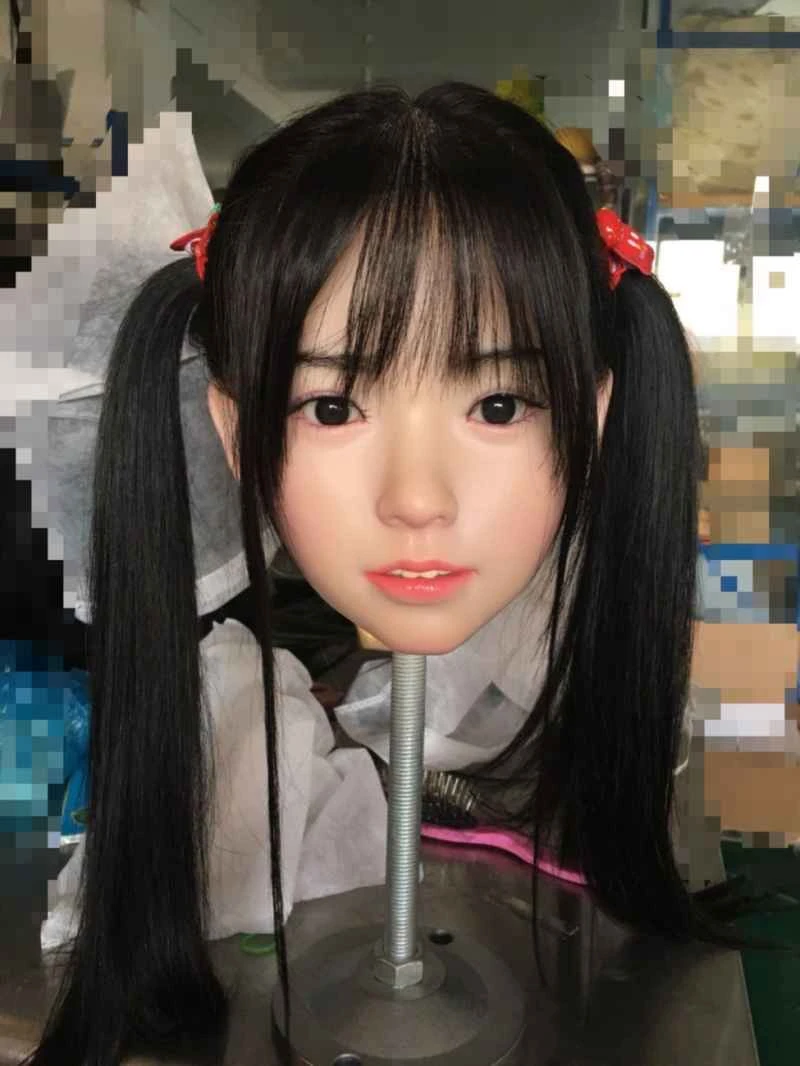
Dynamic measurement of minute displacements based on LabVIEW machine vision
2026-04-06 07:28:16··#1
Abstract: This paper presents a micro-displacement measurement system based on a USB camera, developed using the LabVIEW machine vision platform. The LabVIEW software platform is used to program and control the USB camera, acquiring images of a magnified object moving back and forth within a microscope. The micro-displacement of the object is measured by calculating the number of pixels moved in the image. The system operates at a frame rate of 30 frames per second, enabling dynamic measurement of micro-displacements. Keywords: micro-displacement; LabVIEW; USB camera; reading microscope Introduction Measuring the micro-displacement of objects has wide applications in many fields, such as precision machining in CNC machine tools. Currently, various methods have been developed for measuring the micro-displacement of objects, including laser displacement sensor measurement and capacitive displacement sensor measurement. This paper presents a system for measuring minute displacements based on the LabVIEW machine vision software platform, a reading microscope, and a USB camera. This system is low-cost, easy to operate, and enables real-time dynamic measurement via computer. LabVIEW, developed by NI (National Instruments), is currently the most popular, widely used, fastest-growing, and most powerful graphical data software [1-4]. NI's machine vision platform is a dedicated image processing software platform. This measurement system uses LabVIEW and the machine vision software platform to program and control the USB camera to acquire the movement of the object image from the reading microscope. The computer then determines the minute displacement of the object by judging the pixel movement of the object image. Throughout the experiment, image acquisition and data processing are implemented through LabVIEW software programming. Since the camera's frame rate is 30 frames per second, dynamic measurement, real-time image display, and real-time data saving are possible. 1 Experimental Principle and Idea The minute displacement of the object is magnified by the reading microscope. The magnified image of the object is captured by the camera, and the image is binarized by the computer. The change in the object's displacement can be calculated by the change in the pixel position of the centroid of the image before and after the movement. Figure 1 shows the experimental principle and measurement flowchart. [align=center]Figure 1. Schematic diagram of the micro-displacement measurement experiment[/align] The experimental approach is as follows: The LED on the base of the reading microscope emits uniform and stable light, which illuminates the glass slide on the microscope stage. The movement of the object pulls the filament under the microscope objective, causing a micro-displacement. Here, the displacement of the filament is the displacement of the object. The microscope forms a clear and magnified image of the filament, which is captured by a USB camera placed on the eyepiece and transmitted to a computer for processing. The computer first performs binarization on the acquired image, filters out the influence of the background image, and calculates the position of the centroid of the image. By comparing the position coordinates of the centroid of the images before and after, the pixel point of centroid movement can be calculated. In the experiment, through multiple measurements, the proportionality coefficient between the unit pixel point of the image and the actual displacement of the object is first obtained. When actually measuring the displacement of the object, the change in the pixel point of the image centroid is calculated, and then multiplied by the proportionality coefficient between the change in the unit pixel point and the actual displacement of the object to calculate the actual displacement of the object. The experimental instruments and devices used in the experiment include: a reading microscope (model: JCD-Ⅲ, Shanghai Optical Instrument Factory). The microscope used in the experiment had 10 eyepieces and 10 objectives, providing 100x magnification for the filament. The camera was a standard Logitech QuickView Pro (Logitech), with a resolution of 320×240, 300,000 pixels, and a frame rate of 30 frames per second. The filament was a precisely machined black filament with a diameter of approximately [missing information]. 2. Programming Design of the Measurement System Based on LabVIEW and Vision Development Platform 2.1 Programming Ideas The experiment used LabVIEW vision software platform to programmatically control a USB camera to acquire magnified images of objects in the microscope. By calculating and processing the images, the position change of the centroid pixels of the moving object was calculated to measure the object's minute displacement. In LabVIEW machine programming, the USB camera was programmed to acquire the images. To filter out background images and noise, the acquired images needed to be binarized. By setting a threshold value, pixel values above the threshold were set to the highest pixel value, and those below the threshold were set to zero, thus obtaining a binarized image of the filament. The pixel position of the centroid of the filament image is calculated by calling a specialized module in the vision development platform [5-6], and the number of pixels whose centroid pixel position changes before and after movement is further calculated. During measurement, the actual distance the object moves is obtained by multiplying the number of pixels whose centroid moves by the proportional coefficient of the change in unit pixel position to the actual distance. 2.2 Design of the measurement program display interface The USB camera images the object under test into a digital image, which is then input into the computer and called and displayed by the LabVIEW software platform. Considering the convenience of display, the measurement program is set to display two interfaces. Figure 2 shows the real-time synchronous measurement interface of the measurement program. "Image Tracking" displays the microscopic image of the filament captured by the camera in real time, intuitively showing the image movement. The black object in the figure is the image of the filament; "Results" and "Displacement Record" display the displacement change of the object in real time; clicking the "Start Measurement" button starts the computer and the camera to start the measurement; clicking the "Reset" button restarts the measurement. Considering that the camera is generally unstable when it starts working, the first 15 frames of images acquired after the computer starts the camera to start the measurement are not used. For ease of display, the image acquisition is set to start the measurement after the blue progress bar has completed. This interface allows for intuitive observation of the object's image and displacement. [align=center] Figure 2 Synchronous Measurement Display Interface[/align] 2.3 LabVIEW Programming for Measurement In LabVIEW, calling a USB camera is very simple because the function calls are modularized. Figure 3 shows the LabVIEW programming for calling a USB camera to acquire images. The calling process is as follows: Call the camera ①IMAQ Create.vi —> ②IMAQ USB Grab Setup.vi —> ③IMAQ USB Grab Acquire.vi —> ④IMAQ USB Close.vi, this process captures one static frame. Add a loop ⑥While Loop, which controls the frequency of the While Loop triggering every few milliseconds via ⑤Wait Until Next ms Multiple (the default value is 33.3 milliseconds, which is 30 frames per second), and output ⑦Image Display. [align=center]Figure 3. Image Acquisition via USB Camera[/align] The image acquired from the USB camera undergoes binarization processing as shown in Figure 4: ①The image output from ①IMAQ USB Grab Acquire.vi ②IMAQ ColorImageToArray, and ③Optional Rectangle function is used to extract the valid portion of the acquired image and convert it into a 32-bit two-dimensional array. To facilitate determining the binarization threshold scale, To Unsigned Byte Integer is used to convert the 32-bit array into an 8-bit array. The two-dimensional array is indexed twice using ④For Loop's loop port i and ⑤⑥Index Array. Less Or Equal? and ⑦Select are used to compare each value in the array with a pre-defined threshold value. Values greater than the pre-defined threshold are set to 0 (minimum brightness), otherwise 255 (maximum brightness). The binarized array is then converted into an image for display using IMAQ ArrayToImage, thus transforming the acquired image into only black and white. White represents the image of the object, and black represents the background image. [align=center]Figure 4 Binarized Image[/align] NI's machine vision software platform is specifically designed for image processing and has many dedicated software modules. We selected the centroid calculation module. Inputting the image into the module outputs the coordinates of the image's centroid. Following the experimental design, we needed to pre-measure the ratio of the change in a unit pixel to the actual object's movement distance; therefore, a reading microscope was chosen. The reading microscope allows for precise microscope movement. With the object stationary, precise microscope movement allows us to read the microscope's movement distance and simultaneously calculate the number of pixels that changed in the image. Dividing the movement distance by the total number of pixels yields the ratio of the change in a unit pixel to the actual object's movement distance. In the experiment, the object's movement was achieved by pulling a thin filament under the microscope objective; therefore, the filament displacement is the object's displacement. To obtain a displacement of 100µm, we placed the object on an optical platform controlled by a micrometer screw gauge. The micrometer screw gauge has 50 divisions; one rotation moves 0.5mm, so one small division represents 10µm. By adjusting the micrometer screw gauge, we obtained a displacement range of 100µm. During measurement, the collected data was saved to the computer in real time and then displayed using graphing software. Figure 5 shows the experimental results. The horizontal axis in the figure represents the measurement time, the vertical axis represents the measurement displacement, and the flat part represents the dwell time when moving the micrometer screw gauge. Because the micrometer screw gauge was rotated manually, the inconsistent speed of movement resulted in step-like pauses. [align=center]Figure 5 shows the experimental results, indicating that the object's movement range is[/align] 3. Experimental Error Analysis and Discussion of Improvement Methods The errors in the measurement system mainly come from two aspects: one is the error brought about by the measurement system itself, such as asynchronous movement of the object pulling the filament, vibration of the experimental platform, etc.; the other important error comes from the proportionality coefficient between the change in the unit pixel of the image and the actual object's movement distance. If this coefficient has a large error, the measurement results are unreliable. The method used in the experiment was: keeping the filament stationary, precisely moving the microscope, and reading the movement distance of the microscope; calculating the number of pixels that changed in the filament image, dividing the movement distance by the total number of pixels, to obtain the proportionality coefficient between the change in the unit pixel and the actual object's movement distance. We precisely moved the reading microscope by 100µm, 150µm, and 200µm, repeatedly measuring the change in the number of pixels at the centroid of the filament. Considering hysteresis error, we calculated the average value of this coefficient to be approximately 2µm/pixel. Therefore, the measurement accuracy of the system is 2µm. Using a microscope with higher magnification can achieve even higher measurement accuracy. 4. Summary This paper details a system for dynamically measuring minute displacements based on LabVIEW software and a machine vision platform, utilizing a USB camera and a reading microscope. Image acquisition and data processing during the experiment were implemented through LabVIEW software programming. By utilizing common peripheral equipment (computer, reading microscope, USB camera), the system features high accuracy, simple manufacturing, low technical requirements, convenient operation, and strong portability. The innovation of this paper lies in applying virtual instrument technology to minute displacement measurement, and developing a dynamic minute displacement measurement system based on a USB camera using the LabVIEW machine vision platform. In our experiment, the dynamic measurement accuracy reached 2µm. References [1] Long Fan, Qian Limin, Li Yingchun. Design and implementation of speaker detection system based on LabVIEW and sound card [J]. Microcomputer Information, 2006, 7-1: 90-92. [2] National Instruments Corporation. LabVIEW™ User Manual, National Instruments Corporation, 1998. [3] Jia Yunde. Machine Vision [M]. Science Press. 2000. [4] National Instruments Corporation. IMAQ Vision Concept Manual, 2000. [5] Zhang Yujin. Image Engineering (Volume 1) Image Understanding and Computer Vision [M]. Tsinghua University Press. 2000. [6] Zhang Yujin. Image Engineering (Volume 2) Image Processing and Analysis [M]. Tsinghua University Press. 2000