Share this

Analysis of single-ended test fault location sensitivity

2026-04-06 06:00:42 · · #1
1. Introduction Power distribution lines have complex structures, making fault location in actual systems very difficult. With the development of computer technology, researchers have begun studying fault location in power distribution lines. Fault location methods are broadly divided into those using single-end test information and those using multi-end test information. Power distribution lines are mostly radial structures, and the terminals are usually users who lack the conditions for data testing and recording. Single-end test fault location systems are easy to operate and require less equipment investment, making them popular with field personnel. Single-end test fault location technology requires accurate models, line parameters, and fault data. In single-end test fault location algorithms, if the feeder line has multiple branch points, several equivalent faults will simultaneously appear at points with equidistant electrical distances from the test end. Distinguishing between true and false faults is one of the key issues in power distribution line fault location. This paper will analyze the impact of various test data at the starting end (i.e., power supply voltage, sampling resistor voltage, and their phase difference) on fault location in the single-end test fault location method for power distribution lines from a sensitivity perspective. During fault location, one can start with the test quantities that have a significant impact on fault location to find the characteristics of true fault points and distinguish between true and false faults. [b]2 Establishment of Fault Location Equation for Single-Ended Test of Branchless Line[/b] A short circuit occurs at a distance x from the start of a branchless two-wire transmission line, with a short-circuit transition resistance of R, as shown in Figure 1. If the equivalent impedance seen from the fault point to the line terminal is Zx, it can be considered that Zx and R are connected in parallel at the fault point, and its equivalent impedance is represented by Z. [img=240,101]http://zszl.cepee.com/cepee_kjlw_pic/files/wx/zgdjgcxb/zgdj2000/0001/image1/t73-1.gif[/img] Fig.1 Short-circuit happened at x away from the initial terminal The transmission equation from the initial terminal to the fault point and the circuit equation at the fault point are rearranged as follows [img=236,78]http://zszl.cepee.com/cepee_kjlw_pic/files/wx/zgdjgcxb/zgdj2000/0001/image1/73.1.gif[/img] (1) where Arg (.) is the argument angle. Taking UR as the reference phasor at the test end, then US = US∠φ, therefore: [img=138,41]http://zszl.cepee.com/cepee_kjlw_pic/files/wx/zgdjgcxb/zgdj2000/0001/image1/74.1.gif[/img] Substituting the above equation into equation (1), and letting: [img=235,69]http://zszl.cepee.com/cepee_kjlw_pic/files/wx/zgdjgcxb/zgdj2000/0001/image1/74.2.gif[/img] (2) The propagation constant γ is expressed in the form of the attenuation constant α and the phase constant β. Equation (1) can be rearranged as [img=284,79]http://zszl.cepee.com/cepee_kjlw_pic/files/wx/zgdjgcxb/zgdj2000/0001/image1/74.3.gif[/img] Since the fault location x is a real number, the imaginary part in the above equation should be zero. Therefore, [img=139,42]http://zszl.cepee.com/cepee_kjlw_pic/files/wx/zgdjgcxb/zgdj2000/0001/image1/74.4.gif[/img] (3) Equation (3) is expressed by the fault location x in terms of line parameters, the equivalent impedance of the fault point, and the measured value at the starting end when the fault exists. Assuming the line parameters are accurate, the following discussion focuses only on the sensitivity of the fault location to the starting-end phase measurement, power supply voltage measurement, and sampling resistor voltage measurement. [b]3 Sensitivity of Fault Location to Starting-End Test Data[/b] 3.1 Sensitivity of Fault Location to Phase Measurement Taking the derivative of equation (3) with respect to the phase measurement value φ, we have [img=307,77]http://zszl.cepee.com/cepee_kjlw_pic/files/wx/zgdjgcxb/zgdj2000/0001/image1/74.5.gif[/img] (4) Where [img=303,151]http://zszl.cepee.com/cepee_kjlw_pic/files/wx/zgdjgcxb/zgdj2000/0001/image1/74.6.gif[/img] Since the line parameters are fixed, the measured values ​​US, UR, and φ at the starting end when a fault occurs are all fixed values. Therefore, the right-hand side of the above equation is a definite real number, and the equation can be written as [img=78,42]http://zszl.cepee.com/cepee_kjlw_pic/files/wx/zgdjgcxb/zgdj2000/0001/image1/74.7.gif[/img] (5. In equation (1), for ease of expression, the above equation is written as ArgY=arctg Y1-arctg Y2.) Then [img=287,192]http://zszl.cepee.com/cepee_kjlw_pic/files/wx/zgdjgcxb/zgdj2000/0001/image1/74.9.gif[/img] Since the line parameters are fixed, the measured values ​​US, UR, and φ at the starting end when the fault occurs are all fixed values. The right side of the above formula is a fixed real number. Therefore, the above formula can be written as [img=103,40]http://zszl.cepee.com/cepee_kjlw_pic/files/wx/zgdjgcxb/zgdj2000/0001/image1/74.10.gif[/img](6) Taking f = 10kHz, the wave parameters of the simulated line with three branches (lengths of 400m, 200m, and 200m respectively) are Zc = 491.71 - j14.00Ω, γ = 0.1261 × 10⁻⁴ + j0.2657 × 10⁻³ 1/m. The fault simulation program calculates that when a phase-to-phase short-circuit fault occurs, US = 2.651V, UR = 0.201V, φ = 28.3Ω, and the sampling resistor R0 = 10Ω. The variation of K and K′ when Δφ changes from -1Ω to +1Ω is shown in Figures 2 and 3. [img=230,158]http://zszl.cepee.com/cepee_kjlw_pic/files/wx/zgdjgcxb/zgdj2000/0001/image1/t75-1.gif[/img] Figure 2 Fig. 2. K change with φ [img=225,159]http://zszl.cepee.com/cepee_kjlw_pic/files/wx/zgdjgcxb/zgdj2000/0001/image1/t75-2.gif[/img] Fig. 3. K' change with φ As can be seen from Fig. 2 and Fig. 3, near the phase test value, K and K' have an approximately linear relationship with φ, and their rates of change are approximately equal. From equations (4) to (6), the relative sensitivity of the fault location x to the phase measurement value φ is [img=192,38]http://zszl.cepee.com/cepee_kjlw_pic/files/wx/zgdjgcxb/zgdj2000/0001/image1/74.11.gif[/img]. Since β>>α, when Δφ=0, K and K′ are of the same order of magnitude, so the above equation can be written as [img=77,42]http://zszl.cepee.com/cepee_kjlw_pic/files/wx/zgdjgcxb/zgdj2000/0001/image1/74.12.gif[/img]. (7) The above equation shows that the sensitivity is directly proportional to the phase measurement value φ and inversely proportional to the distance x from the fault point to the starting end. 3.2 The sensitivity of the fault location to the measured values ​​of the power supply voltage and the sampling resistor voltage will be determined by differentiating equation (3) with respect to the measured value of the power supply voltage US. (8) Where [img=315,38]http://zszl.cepee.com/cepee_kjlw_pic/files/wx/zgdjgcxb/zgdj2000/0001/image1/75.1.gif[/img] Consistent with the conditions in equation (6), the right-hand side of the above equation is a definite real number. Therefore, the above equation can be simply expressed as [img=96,41]http://zszl.cepee.com/cepee_kjlw_pic/files/wx/zgdjgcxb/zgdj2000/0001/image1/75.3.gif[/img][font=SimSun] [/font](9) And[img=296,99]http://zszl.cepee.com/cepee_kjlw_pic/files/wx/zgdjgcxb/zgdj2000/0001/image1/75.4.gif[/img ][img=290,60]http://zszl.cepee.com/cepee_kjlw_pic/files/wx/zgdjgcxb/zgdj2000/0001/image1/75.5.gif[/img] The above formula is denoted as [img=123,39]http://zszl.cepee.com/cepee_kjlw_pic/files/wx/zgdjgcxb/zgdj2000/0001/image1/75.6.gif[/img] (10) From formulas (8) to (10), the relative sensitivity of the fault location to the effective value of the power supply voltage US is [img=263,40]http://zszl.cepee.com/cepee_kjlw_pic/files/wx/zgdjgcxb/zgdj2000/0001/image1/75.7.gif[/img] (11) Similarly, by differentiating equation (3) with respect to UR, and following the derivation process of equations (8) to (10), the relative sensitivity of the fault location to UR can be calculated as [img=237,81]http://zszl.cepee.com/cepee_kjlw_pic/files/wx/zgdjgcxb/zgdj2000/0001/image1/75.8.gif[/img] (12). From equations (11) and (12), it can be concluded that the sensitivity of the fault location to US and UR is equal in magnitude but opposite in direction. That is to say, the absolute distance measurement errors caused by US and UR cancel each other out. Let the relative errors of US and UR be εS and εR, respectively. Taking the fault simulation conditions in 3.1, the variation law of P and P′ when εS and εR change from -0.1 to +0.1 is shown in Figures 4 and 5. Among them, curve (i) corresponds to the change of εS, and curve (ii) corresponds to the change of εR. [img=230,154]http://zszl.cepee.com/cepee_kjlw_pic/files/wx/zgdjgcxb/zgdj2000/0001/image1/t75-3.gif[/img] Fig.4. P change with εS and εR [img=230,157]http://zszl.cepee.com/cepee_kjlw_pic/files/wx/zgdjgcxb/zgdj2000/0001/image1/t75-4.gif[/img] Fig.5. P' change with εS and εR [b]4. Influence of Initial Test Parameters on Fault Location in Actual Systems[/b] The influence of the three initial test parameters on fault location is as follows: [img=267,112]http://zszl.cepee.com/cepee_kjlw_pic/files/wx/zgdjgcxb/zgdj2000/0001/image1/76.1.gif[/img] Since K′ and P′ are not much different near the fault test value, the accuracy of the effective value test is much higher than that of the phase test when locating faults in the actual system. Moreover, the influence of the initial test value US and UR on the location is equal in magnitude and opposite in direction, thus canceling each other out. Therefore, the phase test deviation has a greater influence on fault location. [b]5 Conclusion[/b] (1) In the single-end test fault location technology, the initial phase test deviation has a greater influence on fault location. (2) The absolute distance measurement errors caused by US and UR are equal in magnitude and opposite in direction, thus canceling each other out. (3) The closer the fault location is to the test end, the greater the influence of each test parameter on the location. In actual system fault location, the accuracy of phase measurement should be improved as much as possible to ensure the accuracy of location and the reliability of sequencing.
Read next

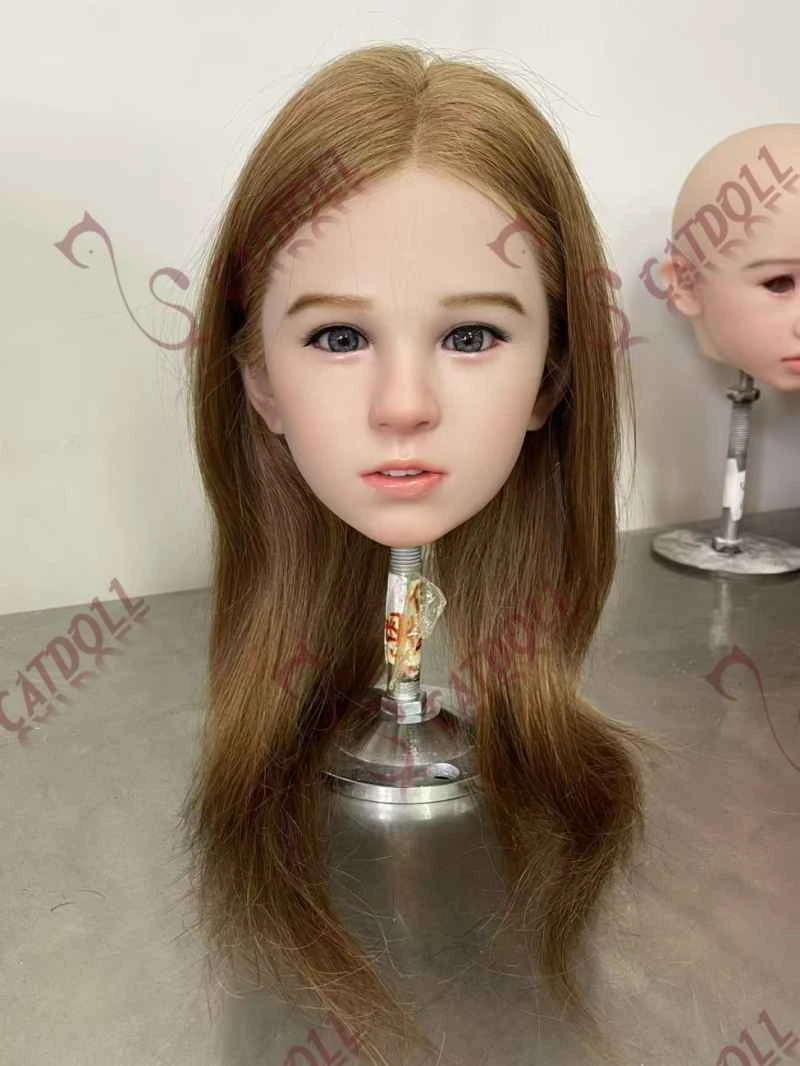
CATDOLL Momoko Soft Silicone Head

You can choose the skin tone, eye color, and wig, or upgrade to implanted hair. Soft silicone heads come with a functio...

Articles 2026-02-22