Share this

Design and application of a high-voltage reactive power compensation monitoring system using LabVIEW.

2026-04-06 03:32:33 · · #1
Abstract: This paper introduces the concept and characteristics of LabVIEW and its application in a high-voltage reactive power compensation monitoring system. It clarifies the basic process of developing monitoring software using LabVIEW. This system differs significantly from traditional monitoring systems in both its hardware and software structure and functions, exhibiting high flexibility and expandability. Keywords: LabVIEW ; High-voltage reactive power compensation; Monitoring system 1 Introduction In recent years, with the continuous increase of high-power nonlinear loads, the reactive power impact and harmonic pollution of the power grid have shown a continuous upward trend, leading to increased line losses, reduced voltage qualification rate, and seriously affecting power supply quality and economy. The use of Static Var Compensators (SVCs) can stabilize system voltage, improve system imbalance, and enhance load power factor. They have been successfully applied to compensate for impact loads in metallurgy, mining, and electrified railways, and have even broader application prospects. In the design and operation of large-capacity, practical SVC devices, the design and implementation of a monitoring system is essential, serving as the central hub for operational information management. Previously, monitoring system software was typically developed using text-based programming languages ​​for specific applications, resulting in unattractive user interfaces, long development cycles, and difficulties in porting and modification. LabVIEW development software, however, offers advantages such as broad hardware support, open interconnectivity, a beautiful graphical interface, and short development cycles, making it particularly suitable for measurement and control automation applications and monitoring system development. SVC monitoring systems based on virtual instrument technology collect, store, and analyze real-time operational data from various subsystems to determine the overall operational status of the SVC device. The analysis results are presented to field operators in an intuitive and easy-to-understand manner, serving as the primary window for developers and users to understand the SVC system status. This paper introduces how to develop an SVC monitoring system using virtual instrument technology on the LabVIEW software development platform, realizing the decentralized issuance of remote operation control commands and centralized monitoring of real-time operation information of the SVC system. 2. Structure and Function of High-Voltage Reactive Power Compensation System SVC devices typically have the following structures: thyristor-controlled reactor (TCR); thyristor-controlled high-impedance transformer (TCT); thyristor-switched capacitor (TSC); TCR+TSC hybrid device; TCR+fixed filter capacitor (FC) hybrid device. Here, we take the TCR+FC type SVC system as an example to design the monitoring system. The SVC system is a highly integrated and complex computer control system, consisting of five subsystems: acquisition unit, control unit, trigger pulse generation unit, monitoring unit, and protection unit. The system comprises several components: a data acquisition unit for detecting three-phase voltage and current; a control and regulation unit for implementing the control algorithm of a closed-loop regulator based on the static compensation principle; a trigger pulse generation unit for synchronization and pulse generation and distribution; a monitoring unit for reconstructing the SVC system structure, setting control parameters, issuing panel operation commands, and dynamically collecting and displaying system operating parameters; and a protection unit for overcurrent and overload protection, valve group over-temperature protection, and BOD protection. 3. Implementation of the High-Voltage Reactive Power Compensation Monitoring System 3.1 Functions and Composition of the SVC Monitoring System The SVC monitoring system can perform the following functions: monitoring the device startup process; real-time acquisition and display of system operating status; online judgment of system fault status; recording important system operating information; transmitting data to a remote computer; long-term system operation status analysis, generating voltage quality and harmonic content analysis reports; and waveform recording and playback during system debugging to assist installation personnel in quickly viewing the system status. These functions provide strong support for the normal operation of the SVC device. Therefore, the SVC monitoring system is developed using an industrial control computer with a built-in data acquisition card and the virtual instrument LabVIEW tool. In addition to data acquisition, the monitoring system is also responsible for communication with other devices and remote data transmission. Using a high-performance industrial control computer makes it easier to complete such complex tasks simultaneously. The use of the graphical programming language LabVIEW encapsulates the underlying hardware interaction, making application development very simple and providing a user-friendly interface. 3.2 Introduction to LabVIEW LabVIEW is a powerful and flexible virtual instrument and measurement and control software development tool provided by National Instruments (NI). It is a graphical programming language, abbreviated as G language. Its programming process describes program behavior through graphical symbols. It provides a large number of virtual instrument components and function libraries to facilitate programming and can be directly used to implement data acquisition, network communication, file input/output, GPIB and serial instrument control, and data analysis. Because LabVIEW programming is entirely graphical, unlike other text-based programming tools, this "what you see is what you get" intuitive effect greatly facilitates engineering technicians. LabVIEW provides the industry's largest instrument driver library, as well as various control models from different industrial fields. Users can inherit and optimize based on the basic control models as needed. LabVIEW also supports data sharing through interactive communication methods such as the Internet, ActiveX, DDE, and SQL, and also supports object-oriented programming. Simultaneously, LabVIEW directly supports RS-232 and RS-485 interfaces on microcomputers, requiring no external boards, and can achieve instrument control and data transmission through software programming. In the LabVIEW development environment, users can select appropriate control models as needed to design VIs that meet user requirements and are both aesthetically pleasing and practical. 3.3 SVC Monitoring Software Design The design and implementation of the software is the main work in developing an SVC monitoring system, and also the most challenging aspect. There are two important design concepts in using LabVIEW for SVC monitoring system programming: "program function determines program structure" and "data flow." Because LabVIEW programs are composed of multiple interconnected and nested sub-VIs with consistent structure and interface models, each sub-VI is a well-encapsulated VI performing a specific function. Therefore, the program structure is essentially determined by the division of program functions. Furthermore, different sub-VIs are connected through "data flow," and the data flow is the processing object of the sub-VIs, determining the program flow. Thus, determining the content and direction of the data flow determines the program's function and structure. Based on these concepts and the characteristics of LabVIEW, the SVC monitoring system software design adopts a master-slave program structure based on function. First, the various functions of the monitoring system are determined, and then the program structure is determined according to the functions and the flow of data to be processed. The main interface of the SVC monitoring software is shown in Figure 1, mainly including the main interface, real-time data, real-time curves, harmonic monitoring, historical curves, power factor statistics, fault records, silicon state monitoring, and system parameter screens. Pressing the corresponding button will enter its corresponding screen. [align=center]Figure 1 Main Interface of Monitoring Software[/align] During operation, the monitoring system periodically sends operation parameter call commands to the lower-level computer. After correctly receiving the call command, the lower-level computer uploads the system operation parameters (system voltage, current, active power, reactive power, power factor, etc.) to the upper-level computer and displays them on the main interface. 3.3.1 Real-time Data Function When the real-time data button is pressed, the real-time data screen is entered, which can display the current three-phase power, voltage, current data of the power grid, and valve group temperature, etc. 3.3.2 Real-time Curve Function When the real-time curve button is pressed, the curve screen is entered. It can automatically detect various specified monitoring quantities, including various data screens reflecting the real-time operating status such as current, voltage, frequency, and power factor, and conveniently provides real-time monitoring curves for specified parameters. 3.3.3 Harmonic Monitoring Function When the harmonic monitoring button is pressed, the harmonic status of the system and the harmonic spectrum will be displayed, as shown in Figure 2. Clicking the tab allows you to select the phase where the harmonic is located. Clicking the "Increase" or "Decrease" buttons for harmonic component selection (or directly entering the value in the input box) allows you to select the order of harmonics, such as the 3rd, 5th, or 7th harmonic. The amplitude and THD (Harmonic Distortion) of the selected harmonic will be displayed in the display box below. [align=center] Figure 2 Harmonic Monitoring Sub-interface[/align] 3.3.4 Historical Data List Function After pressing the "Historical Curve" button, you will enter the historical data table. The historical data list function can automatically detect and store specified monitoring quantities, and can display different types of data on multiple different tables. Using the selection keys, you can easily select the desired table screen. It can also generate a historical curve graph for a vivid observation of the system status at any given time. You can also retrieve the data record for that time by entering a specific time. 3.3.5 Power Factor Statistics Function After pressing the "Power Factor Statistics" button, you will enter the power factor statistics screen. In this screen, you can observe the trend of the power factor of the power grid over a specified time period and perform corresponding processing on this data. 3.3.6 Fault Record Viewing Function: Pressing the fault record button enters the fault record screen. This interface stores fault alarm information of the monitoring system, including fault alarms of valve groups, BOD, mains voltage, and current. Operators can also retrieve the system fault record for that time by entering a specific time and can print the record. 3.3.7 Silicon Status Monitoring Function: The silicon status monitoring interface monitors the operating status of all valve groups. When a valve group fault or BOD activation triggers an alarm, clicking the silicon status monitoring button allows for a direct view of which silicon or BOD triggered the alarm, facilitating maintenance. This interface also features a valve group over-temperature alarm indicator. 3.3.8 Parameter Setting Function: Pressing the parameter setting button pops up a user login dialog box. Only by entering the correct password can one access this screen for settings, effectively preventing accidental operation by non-professionals. This screen is mainly used to set all operating parameters and serial port configurations of the SVC device. Operators can set these parameters according to actual operating conditions. 4 Conclusion The SVC monitoring system developed based on LabVIEW software has many advantages over traditional monitoring systems. Its operation interface is intuitive and realistic, the operation mode can be switched flexibly, the system operation information is comprehensive and clear, and the hardware circuit is simple, the reliability is high, the software functions are rich, and the scalability is good. The system has been put into operation and has realized the online real-time monitoring and control of various parameters of the high voltage reactive power compensation device. The actual operation results have also proved the correctness of the SVC control system and the superiority of the LabVIEW-based SVC monitoring system. References: [1] LabVIEW 8.20 Programming and Application Beijing: Electronic Industry Press, 2008. [2] Lu Shuai, Design and Implementation of Static Var Compensator Controller [Dissertation] Beijing: Department of Electrical Engineering and Applied Electronic Technology, Tsinghua University, 2002. [3] Ai Xin, Virtual Instrument Technology and Its Application in Power System Automation, 2001. [4] Ma Guohua, Monitoring Configuration Software and Its Application Beijing: Tsinghua University Press, 2002.
Read next

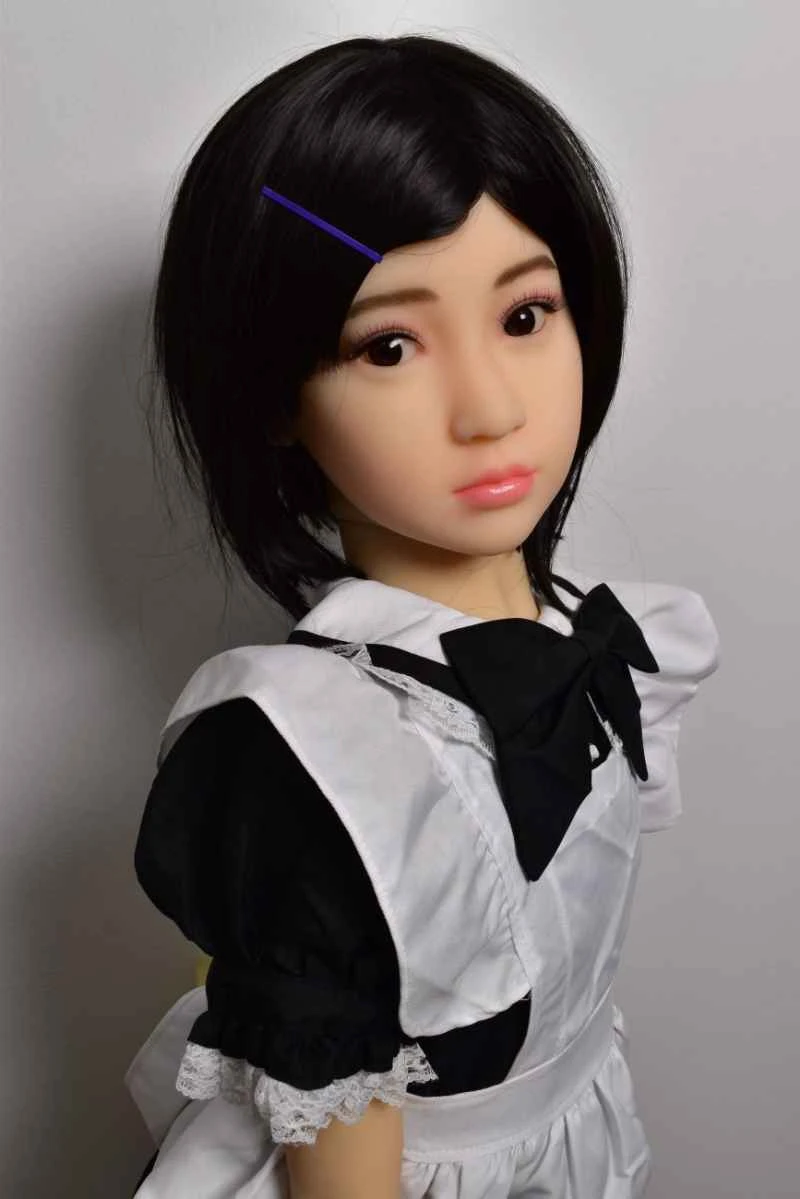
CATDOLL 138CM Tami Silicone Doll

Height: 138 Silicone Weight: 24kg Shoulder Width: 31cm Bust/Waist/Hip: 65/62/78cm Oral Depth: N/A Vaginal Depth: 3-15cm...

Articles 2026-02-22