Share this

Development of an ICRH transmitter monitoring system based on LabVIEW

2026-04-06 05:08:15 · · #1
Abstract: This paper mainly introduces the development of a computer monitoring system for the electron tube electrical parameters of the HT-7 ion cyclotron resonance heating system transmitter, based on the visual development software LabVIEW. During the monitoring process, this system continuously collects the corresponding electrical parameters of the tetrodes. If a component operates outside its rated conditions, it issues audible and visual alarms to alert on-site personnel and saves the data. The entire system is relatively complete, especially providing a comprehensive monitoring method for effective system monitoring and on-site maintenance during long-term transmitter use. Furthermore, by employing event-driven computing, channel selection algorithms, spectrum analysis, and mathematical analysis techniques, the system fully records the actual operating status of the transmitter system. In particular, the channel selection algorithm solves the problem of not being able to change the number of online channels during data acquisition, achieving good results in the experimental stage. Keywords: data acquisition, transmitter, monitoring, alarm, ion cyclotron resonance heating system Development of monitored control system of ICRH based on Labview Abstract: In this paper, the monitor and control unit of Ion Cyclotron Range of Frequency heating (ICRH) system on HT-7 is mainly presented. The whole system is based on Labview system. Because of the tetrode working in severe condition, such as high voltage over to 13.5kV, the whole system must be under control. This system acquires the corresponding electric parameter of the tetrode constantly during the process of measuring. If the corresponding component while out of the specified range, the system will give sound and vision alarm. By using event-driven, channel-selected algorithm and FFT, we could record and show the true working state of the transmitter system and corresponding analysis exactly. Moreover, the algorithm of the channel selection solves the problem which was unable to switch the channels online while data acquiring at any time. Key words: Data acquisitions, ICR heating system, monitor and control unit, alarm 1. Introduction China's first superconducting tokamak, the HT-7 device, is a massive nuclear fusion toroidal vacuum magnetic cage experimental device. It mainly comprises the HT-7 superconducting tokamak device body, a large-scale ultra-high vacuum system, a large-scale computer control and data acquisition and processing system, a large-scale high-power pulse power supply and its circuit system, the largest cryogenic liquid helium system in China, a megawatt-level low-hybrid wave current drive and radio frequency wave heating system, and dozens of complex diagnostic and measurement systems. One of the important objectives of nuclear fusion research is to find a way to heat plasma to above 10 keV. Ion cyclotron wave heating mainly involves feeding wave energy into the plasma through an antenna. This paper mainly introduces a LabVIEW-based real-time monitoring system for an ion cyclotron resonant heating transmitter. This system monitors the electrical parameters of the device and performs feedback control of the radio frequency waveform as required. The signals to be detected include analog voltage, switching signals, and pulse signals. Simultaneously, the system acquires signals at different speeds and saves them to a hard disk. 2. HT-7 Ion Cyclotron Resonance Heating Transmitter System Principle and Main Monitoring Objects This system primarily heats plasma, hence its high output power. It first outputs a 30-150MHz, 10mW oscillation signal from a signal source, followed by RF modulation and a three-stage amplification process involving a broadband amplifier, a preamplifier, a driver amplifier, and a final amplifier, ultimately delivering a maximum output power of 300kW to heat the plasma in the vacuum chamber. This paper mainly analyzes the data acquisition system shown in Figure 1. The monitoring system primarily monitors the voltage, current, and power of each pin of the transmitter's tetrode. Due to the high cost of the equipment used, the voltages of each stage of the tetrode reach several thousand volts, or even tens of thousands of volts, and the current reaches several hundred amps. Furthermore, variations in the parameters of each stage of the tetrode significantly affect the transmitter's output and the lifespan of the tubes. The highest voltage of the anode in the final stage can reach 13.5 kV, and the filament current in the final stage can reach a maximum of 400 A. Under such high voltage and high current conditions, without a comprehensive understanding of the system, unexpected accidents can occur during the operation of each stage of the tubes. These accidents can range from minor shutdowns and delays in testing to serious damage to components, causing irreparable problems. Therefore, amplifier testing is undoubtedly of paramount importance. Currently, testing is mainly conducted through analog equipment and on-site observation. This acquisition scheme aims to address the issues of insufficient safety, accuracy, and real-time performance. [align=center] Figure 1 Transmitter System Schematic Diagram[/align] 3. System Implementation 3.1 Hardware Part [align=center] Figure 2 Monitoring System Flowchart[/align] Since the measured current and voltage of this acquisition system are both relatively high, some conversion and isolation are required to obtain the signals input to the computer. The hardware design of the conversion and isolation parts will not be introduced in this article. The main focus is on the subsequent processing of the signals that have been converted and opto-isolated. The acquisition card uses the National Instruments PCI-6014 multifunction card, which has 16 single-ended inputs or 8 dual-ended inputs, 16-bit accuracy, 200kS/s sampling rate, 512 words of memory, two analog output channels, and data transfer is performed in DMA or interrupt mode. One industrial computer with a Pentium III processor with a main frequency of 1GHz, 512M memory, and Win2000 operating system is used. 3.2 The software design begins with requirements analysis, listing relevant requirements for data acquisition, data analysis, data display, and data transmission. Based on the analysis of these requirements and a comprehensive consideration of cost and accuracy, corresponding solutions are proposed for both software and hardware. The flowchart of the software system is shown in Figure 2. Since multiple acquisition devices are used, the selection of these devices is considered. Secondly, alarm upper and lower limits need to be set. Then, the input channels are inspected; acquisition can begin as long as one channel is selected; otherwise, it waits for channel selection. The heating system coordinates with the central control unit. Waveform data acquisition awaits triggering. When an external trigger is issued, the system's card D/A output program is activated, outputting the required analog signal. Simultaneously, the reflected incident wave acquisition program is triggered, and the server sends a shot number as a data storage marker for subsequent analysis. Then, the data from each channel is compared with the set value. If it is within the set range, no alarm signal is issued; otherwise, an alarm signal is issued, and the alarm location is displayed for on-site handling. To meet these requirements, the following modules are designed: setting module, display module, storage module, analysis module, feedback control module, and communication module. The settings module is mainly divided into two parts: first, setting sampling parameters, including sampling frequency, number of samples or sampling time, sampling mode, and sampling channels; second, setting limits for the amplifier's gate, bias voltage, anode voltage, and filament current in three levels, with presets saved in a file. The display module displays the data collected from each channel in a waveform scanning mode, allowing for zooming in and out of the graph, and includes a cursor display for easy signal comparison and amplitude measurement. It also compares the measured values ​​with preset values, issuing alarm signals, alarm lights, or sounds, and displaying the alarm location and value. The save module automatically saves relevant parameters as electronic data during operation upon external triggering, adding a file header and time information for later analysis, and saving data named after the shot number. The analysis module provides basic spectrum analysis and other functions. The feedback control module's main function is to provide feedback control to the waveform setpoints after receiving a trigger from the central control unit. The communication module obtains shot number data from the network as an identification mark for saved data and also publishes relevant experimental data. 3.3 Modules and Some Algorithms To achieve comprehensive monitoring of the entire transmitter's operating status, the system requires certain algorithms to meet the requirements. These include channel selection algorithms, PID control algorithms, multi-channel data image multi-channel display and multi-channel data single-channel display, and message mechanisms. The channel selection algorithm and PID control algorithm are briefly introduced below. This system is implemented in LabVIEW. Since it uses an NI acquisition card, virtual channels can be arbitrarily set as required in the Measurement & Automation environment, facilitating the implementation of the channel selection algorithm. In LabVIEW programming, NI's visual controls and its Ni-Daq control are used, making data acquisition particularly convenient and allowing for simultaneous analysis and display. Using LabVIEW software plays a significant role in leveraging the original manufacturer's acquisition card. [align=center] Figure 3 Channel Selection Algorithm Flowchart[/align] 3.3.1 Channel Selection Algorithm. Before acquisition, the 16 channels of the acquisition card need to be set. During the acquisition process, it is required that the channels can be changed arbitrarily, i.e., the number of channels can be switched at will, and the channel acquisition values ​​should be displayed without affecting other processes. The selection status of each channel should be indicated by indicator lights. The basic process is shown in Figure 3. The channel selection is passed to the acquisition function in the form of an array. First, the input channel is set. The channel selection uses a Boolean control, and the channel control uses local variables in LabVIEW advanced programming. The state of the Boolean control for channel selection is mapped. The set Boolean values ​​are sequentially input into a Boolean array. Then, an "OR" operation is performed on the array. If it is true, the process continues; otherwise, it continues to wait for the input channel. This is to ensure that at least one channel is open before acquisition can begin. Then, the array is searched and appended with strings to form the following string array. That is, if the first and second channels are selected, the channel array is [channel 0, channel 1], etc. This array can be set in advance in Measurement & Automation Explorer, and LabVIEW can recognize this array during the acquisition process. In addition, considering that all channels may need to be opened at once before acquisition, and single input is cumbersome, in this case, [align=center] Figure 4 Implementation of the channel selection algorithm in LabVIEW[/align] only needs to use a Boolean control. After the condition is true, a string array of all channels is formed, that is, [channel 0, channel 1, channel 2... channel 15]. This array can be directly called by the acquisition function. Through the above process, channel numbers can be flexibly set during the acquisition process, independently of other processes. Figure 4 shows the program implemented in LabVIEW. I0, I1...I15 are local variables of the channel Boolean control. Through the for and case structures, the output acquisition channel array is implemented, and the function of changing the channel online at any time is realized. 3.3.2 PID Control Algorithm In order to set and control the output waveform, the PID control algorithm is adopted. The motion equation of the PID controller is: [align=center] Figure 5 Implementation of PID output in LabVIEW[/align] Y(t) = where Y(t) is the output signal, e(t) is the input deviation, Kp is the amplification factor, Ti is the integral time constant, and Td is the derivative time constant. The PID controller is implemented on the computer using an incremental algorithm. As shown below, the incremental algorithm does not need to accumulate in the calculation. The incremental output is only related to the previous sampling inputs. This algorithm is a recursive process, and the implementation process is relatively simple. In this application, the PID control of LabVIEW is used to implement the above algorithm. At the same time, the PID controller parameters can be set, as shown in Figure 5. 4. Actual Test Results and Conclusions In the most recent experiment, this monitoring system, due to its reasonable parameter settings and comprehensive functions, played a crucial role in monitoring the transmitter's electrical parameters. Figure 6 shows a screenshot of the interface during the test. During the experiment, alarms for abnormal phenomena provided first-hand information for on-site personnel to promptly identify and resolve problems. Furthermore, the saved data provides extremely important basis for optimizing experimental parameters in future detailed analysis and simulation of the transmitter's working principle. This paper also provides valuable reference for testing and automation applications in LabVIEW. The authors' innovation lies in the use of local variables in advanced programming, which solved the problem of not being able to dynamically change channels during the acquisition process [align=center]Figure 6 Screenshot of HT-7 transmitter monitoring system interface[/align], playing a vital role in the system's monitoring function. Simultaneously, the adoption of a PID control algorithm significantly improved the accuracy of feedback output. In addition, the integration of sound and visual alarm functions, fault and operational data storage, and communication functions provides convenient and quick means for on-site processing and use. Furthermore, this method lays a good foundation for the application of computer-based feedback and timing control of multi-branch systems. References: 1. Zhang Yuxing et al., eds., *RF Analog Circuits*, Electronic Industry Press, September 2002. 2. Zhong Yuanchang, ed., *Practical Application of Electron Tube Amplifier Circuits*, Fujian Science and Technology Press, 2001. 5. 3. *Electron Tube Handbook*, eds. Zheng Guochuan and Li Hongying, Fujian Science and Technology Press, 2002. 10. 4. Zhu Shiyao, ed., *Principles of Nuclear Fusion*, University of Science and Technology of China Press, June 1992. 5. Lei Zhenshan, ed., *Practical Technical Tutorial of LabVIEW 7 Express*, China Railway Publishing House, 2004. 3. 6. Ai Yanting, Huang Fuxing, Li Jie, Software Design of Virtual Signal Analyzer Based on LabVIEW, Microcomputer Information, 2005, 5: 175-176.
Read next

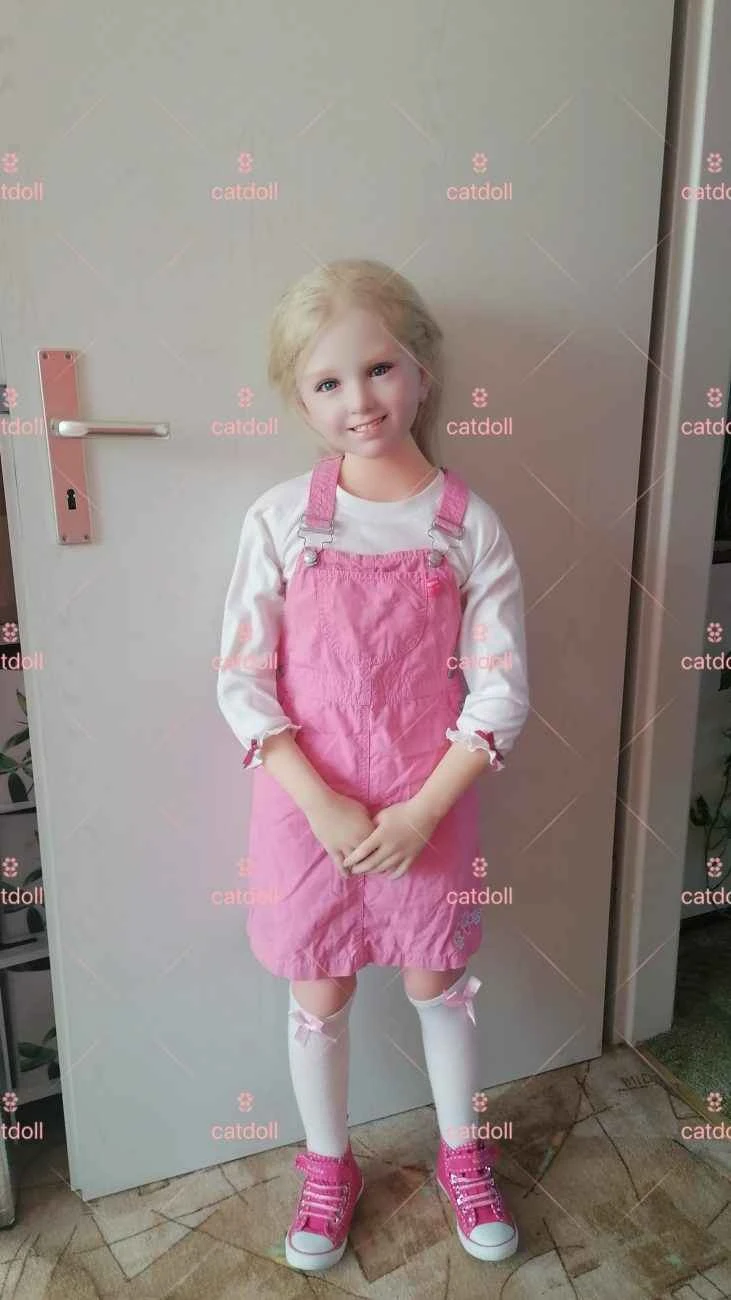
CATDOLL 135CM Laura (Customer Photos)

Crafted with attention to detail, this 135cm doll offers a well-balanced and realistic body shape that feels natural in...

Articles 2026-02-22